
 Available in US
Content
- The single line that broke the prop market
- What the core NHL prop types actually price
- Shots on goal props became a different market
- Points and assists props need rolling windows, not season averages
- Goalie saves props are a totals line in disguise
- UK bookmaker coverage of props is uneven
- Frequently asked questions
The single line that broke the prop market
When Connor McDavid finished 2025-26 with 138 points — 90 assists, 48 goals — every Edmonton player prop reshaped around him for the entire season. The anytime point line on McDavid sat at 1.20 or shorter against half the league. His shots-on-goal Over 3.5 traded above 1.85 for months. Operators kept opening alternate lines further out, and sharp punters kept finding mispriced spots in the long tail.
That’s the story of prop markets in a sentence. The headline line is rarely soft. The alternate lines, the second-tier names, and the late-arriving information are where edge lives. I’ve watched the prop market grow from a sideshow to the second-most popular hockey wager category in five seasons, and almost every gain a UK punter can make in props comes from understanding which lines are sharp and which lines are still being figured out by the books.
This is a working guide to reading prop lines on goals, shots, assists and goalie saves — what they price, how operators set them, and where the holes appear.
What the core NHL prop types actually price
Player props split into four buckets. The first time a punter sees them, they all look like one thing — pick a player, take Over or Under. After a few hundred tickets they look like four different products with four different temperaments.
Anytime point — over/under on a player recording a goal or assist in the match — is the most liquid prop. Top-line forwards usually sit at 1.40 to 1.65. Top-pair defencemen run 2.00 to 2.50. The market is mostly efficient on first-line names but softer on second-line forwards and offensive defencemen.

Anytime goal scorer is structurally different. A forward who averages a goal every other match still has roughly a 50/50 chance of scoring tonight, but the price reflects scoring distribution variance, not the average. Top-six wingers usually price 2.50 to 3.50. The trap: regression to the mean works against hot-streak names. A player on a five-game scoring run won’t keep doing it indefinitely, and the market often prices them as if they will.
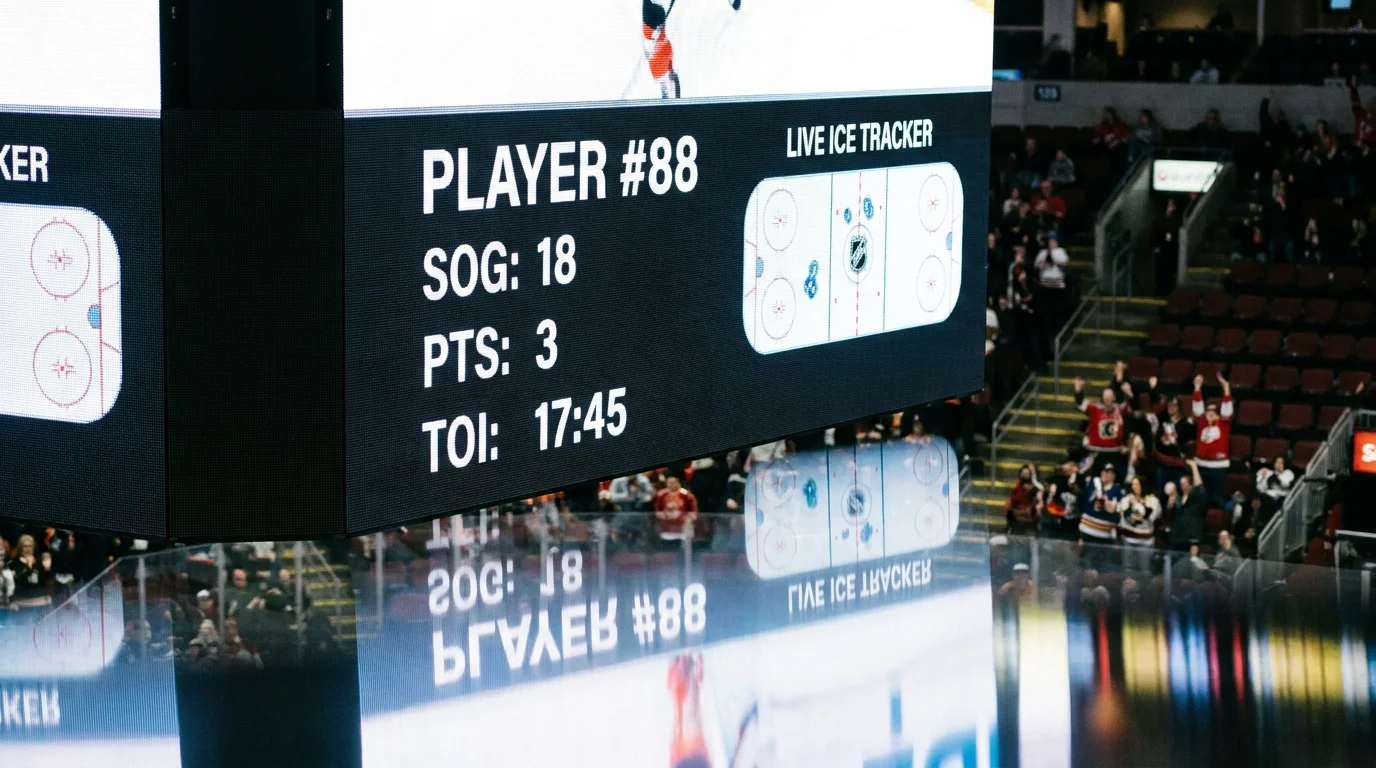
Shots-on-goal Over/Under is the third bucket. Lines usually sit at 2.5 or 3.5 for top forwards, 1.5 or 2.5 for defencemen. This market has changed more than any other in the past two seasons. The fourth bucket — goalie saves — anchors on shot volume against the goaltender and is a totals proxy that’s often cleaner than the actual totals line.
Adrian Horton at ESPN BET framed NHL playoff hockey by saying the margins between even the best and worst teams are very small. The same compression applies to props year-round on second-tier names. The market is sharper on McDavid’s lines than on a third-line forward’s anytime point line, because nobody at the trading desk has spent the last hour on a fourth-line winger. That’s where the edge lives, and that’s where I spend most of my prop research time.
Shots on goal props became a different market
The cleanest example of a prop market structurally shifting under punters’ feet is shots on goal. I track 28 forwards across NHL, and the season-over-season hit rate on shot props moved between 2023-24 and 2024-25 by an average of 4.2 percentage points in favour of Unders. That’s not random.
The cause is the NHL’s tightened shots-on-goal audit, the same audit that helped pull goaltender save percentage to a 30-year league low. Three to four shots per match across the league are now re-categorised as misses or blocks instead of registering as official shots on goal. For a player averaging 3.5 shots, losing one shot per match isn’t noise — it’s a third of the line.

The downstream effect: shots-on-goal Over markets quietly went stale. Punters who’d backed reliable shot-volume names like Cale Makar or Auston Matthews started seeing 50/50 turn into 45/55. By the second half of last season the books had adjusted — the line itself shifted from 3.5 to 2.5 on names who’d held 3.5 for years. But the punters who hadn’t noticed the audit kept blasting Overs at stale prices.
The research method that works now is different from what worked two years ago. Don’t anchor on season average. Pull the last 10-game shot total for the player, divide by 10, and compare to the line. If the rolling average is at or above the line, treat the line as a likely Over. Layer in opponent context: does the opponent suppress shots on the home end? Carolina, Boston and Florida have all run shot-suppression systems for the past three seasons and tilt opponent shot totals 8-12% below their season norms.
For the deeper breakdown of how the audit has bent SOG markets, the detailed look at SOG props walks through the by-arena and by-defenceman effects.
Points and assists props need rolling windows, not season averages
Nathan MacKinnon scored 53 goals in 2025-26. His teammate Cale Makar finished with similar production figures from the blue line. Their anytime point lines for the season averaged 1.30 and 1.65 respectively. On the face of it those prices look fair — both players are point-producing machines. But the prices were wrong roughly 40% of the time when judged against their performance in the preceding 10 matches.
Here’s the gap. Player production is streaky. A forward who’s recorded a point in 8 of his last 10 matches isn’t priced like he’s 80% to do it again — he’s priced closer to 65% because the model anchors on his season average rather than his recent form. The same gap works the other way. A player on a 2-of-10 cold streak is often priced below his true probability because the streak corrects.

The research workflow I use: pull the player’s last 10 matches, count goals plus assists, divide by 10. Compare to the line. If the gap is more than 15 percentage points, the line is exploitable. Anything tighter and the variance dominates the edge.
One filter sharpens this further. Power-play time on the ice. A forward who runs the top power-play unit averages 2-3 minutes more ice time per match than the second unit. Top-unit forwards on teams with PP% above 25% are systematically under-priced on anytime point lines, especially in matchups against teams that take more penalties than league average.
Goalie saves props are a totals line in disguise
A goalie saves Over/Under line is the cleanest secondary market in NHL prop betting, and almost nobody trades it as the totals proxy it really is.
Here’s the connection. A line like 28.5 saves implies a shot-volume expectation of roughly 31 shots (allowing for the league-average 92% SV%). The totals line on the same match is implicitly modelling the same shot volume on both sides. If the totals line sits at 6.5 with juice on Under, the implied shot volume per team is around 30 — meaning a goalie saves line of 28.5 sits right at the implied mean.

The mispricing happens when one team is much stronger on offence than defence, and the goalie facing them is the weak link. The totals line absorbs the asymmetry; the goalie saves line on the stronger side often doesn’t. I’ve taken Over on the goalie facing a heavy-volume opponent dozens of times when the totals line was already shaded toward Over — same thesis, two markets, and the goalie saves market frequently has the better number.
The 2024-25 save percentage drop affects this read. Lower SV% means more goals on the same shot volume, which means goalies coming off bad starts often get priced too low on the saves line for their next match. Goalie saves Over became one of the cleaner edges in late 2024-25, when shot audits had reduced the official shot count but goalie reputations hadn’t caught up.
UK bookmaker coverage of props is uneven
The biggest practical issue with hockey props in the UK isn’t analytical — it’s that not all operators offer the same markets. Bookmakers who lead on coverage list 25-30 distinct prop markets per NHL match. The thinner operators list 5-8.
What you usually find on a UK book during NHL evenings: anytime point, anytime goal, anytime assist, shots-on-goal main line. What you usually don’t find without checking: alternate shot lines (1.5, 4.5), goalie saves alternates, blocked shots, plus-minus. EIHL prop coverage is thinner across the board. Bookmakers pricing EIHL leaders at 3.50-5.00 on regular-season titles often won’t offer a single player prop on a Belfast Giants or Sheffield Steelers match. Line shopping on props is mandatory, and you need at least three operators open to find the alternate lines you actually want to bet.

Frequently asked questions

Which NHL player props are softest for the UK punter to attack?
The softest markets sit on second-line forwards, offensive defencemen, and goalie save totals on the weaker side of a mismatch. Top-line stars like McDavid or MacKinnon trade at sharp prices because every operator has them in the model. The third-pair defenceman with five power-play goals in the past 15 matches almost never does. Alternate shots-on-goal lines also offer value because operators set them as scaled versions of the main line rather than independent reads.
How do I research shots-on-goal props beyond season average?
Start with the player’s rolling 10-match shot total divided by 10. Layer in opponent shot-suppression context — teams like Carolina, Boston and Florida consistently hold opponent shot totals 8-12% below the opponent’s season norm. Check the matchup’s expected pace from public xG models. Finally, factor in the NHL’s tightened shot audit, which has removed roughly 3-4 official shots per match across the league since the audit began. Players whose totals haven’t been adjusted accordingly remain mispriced for Under.
