
 Available in US
Content
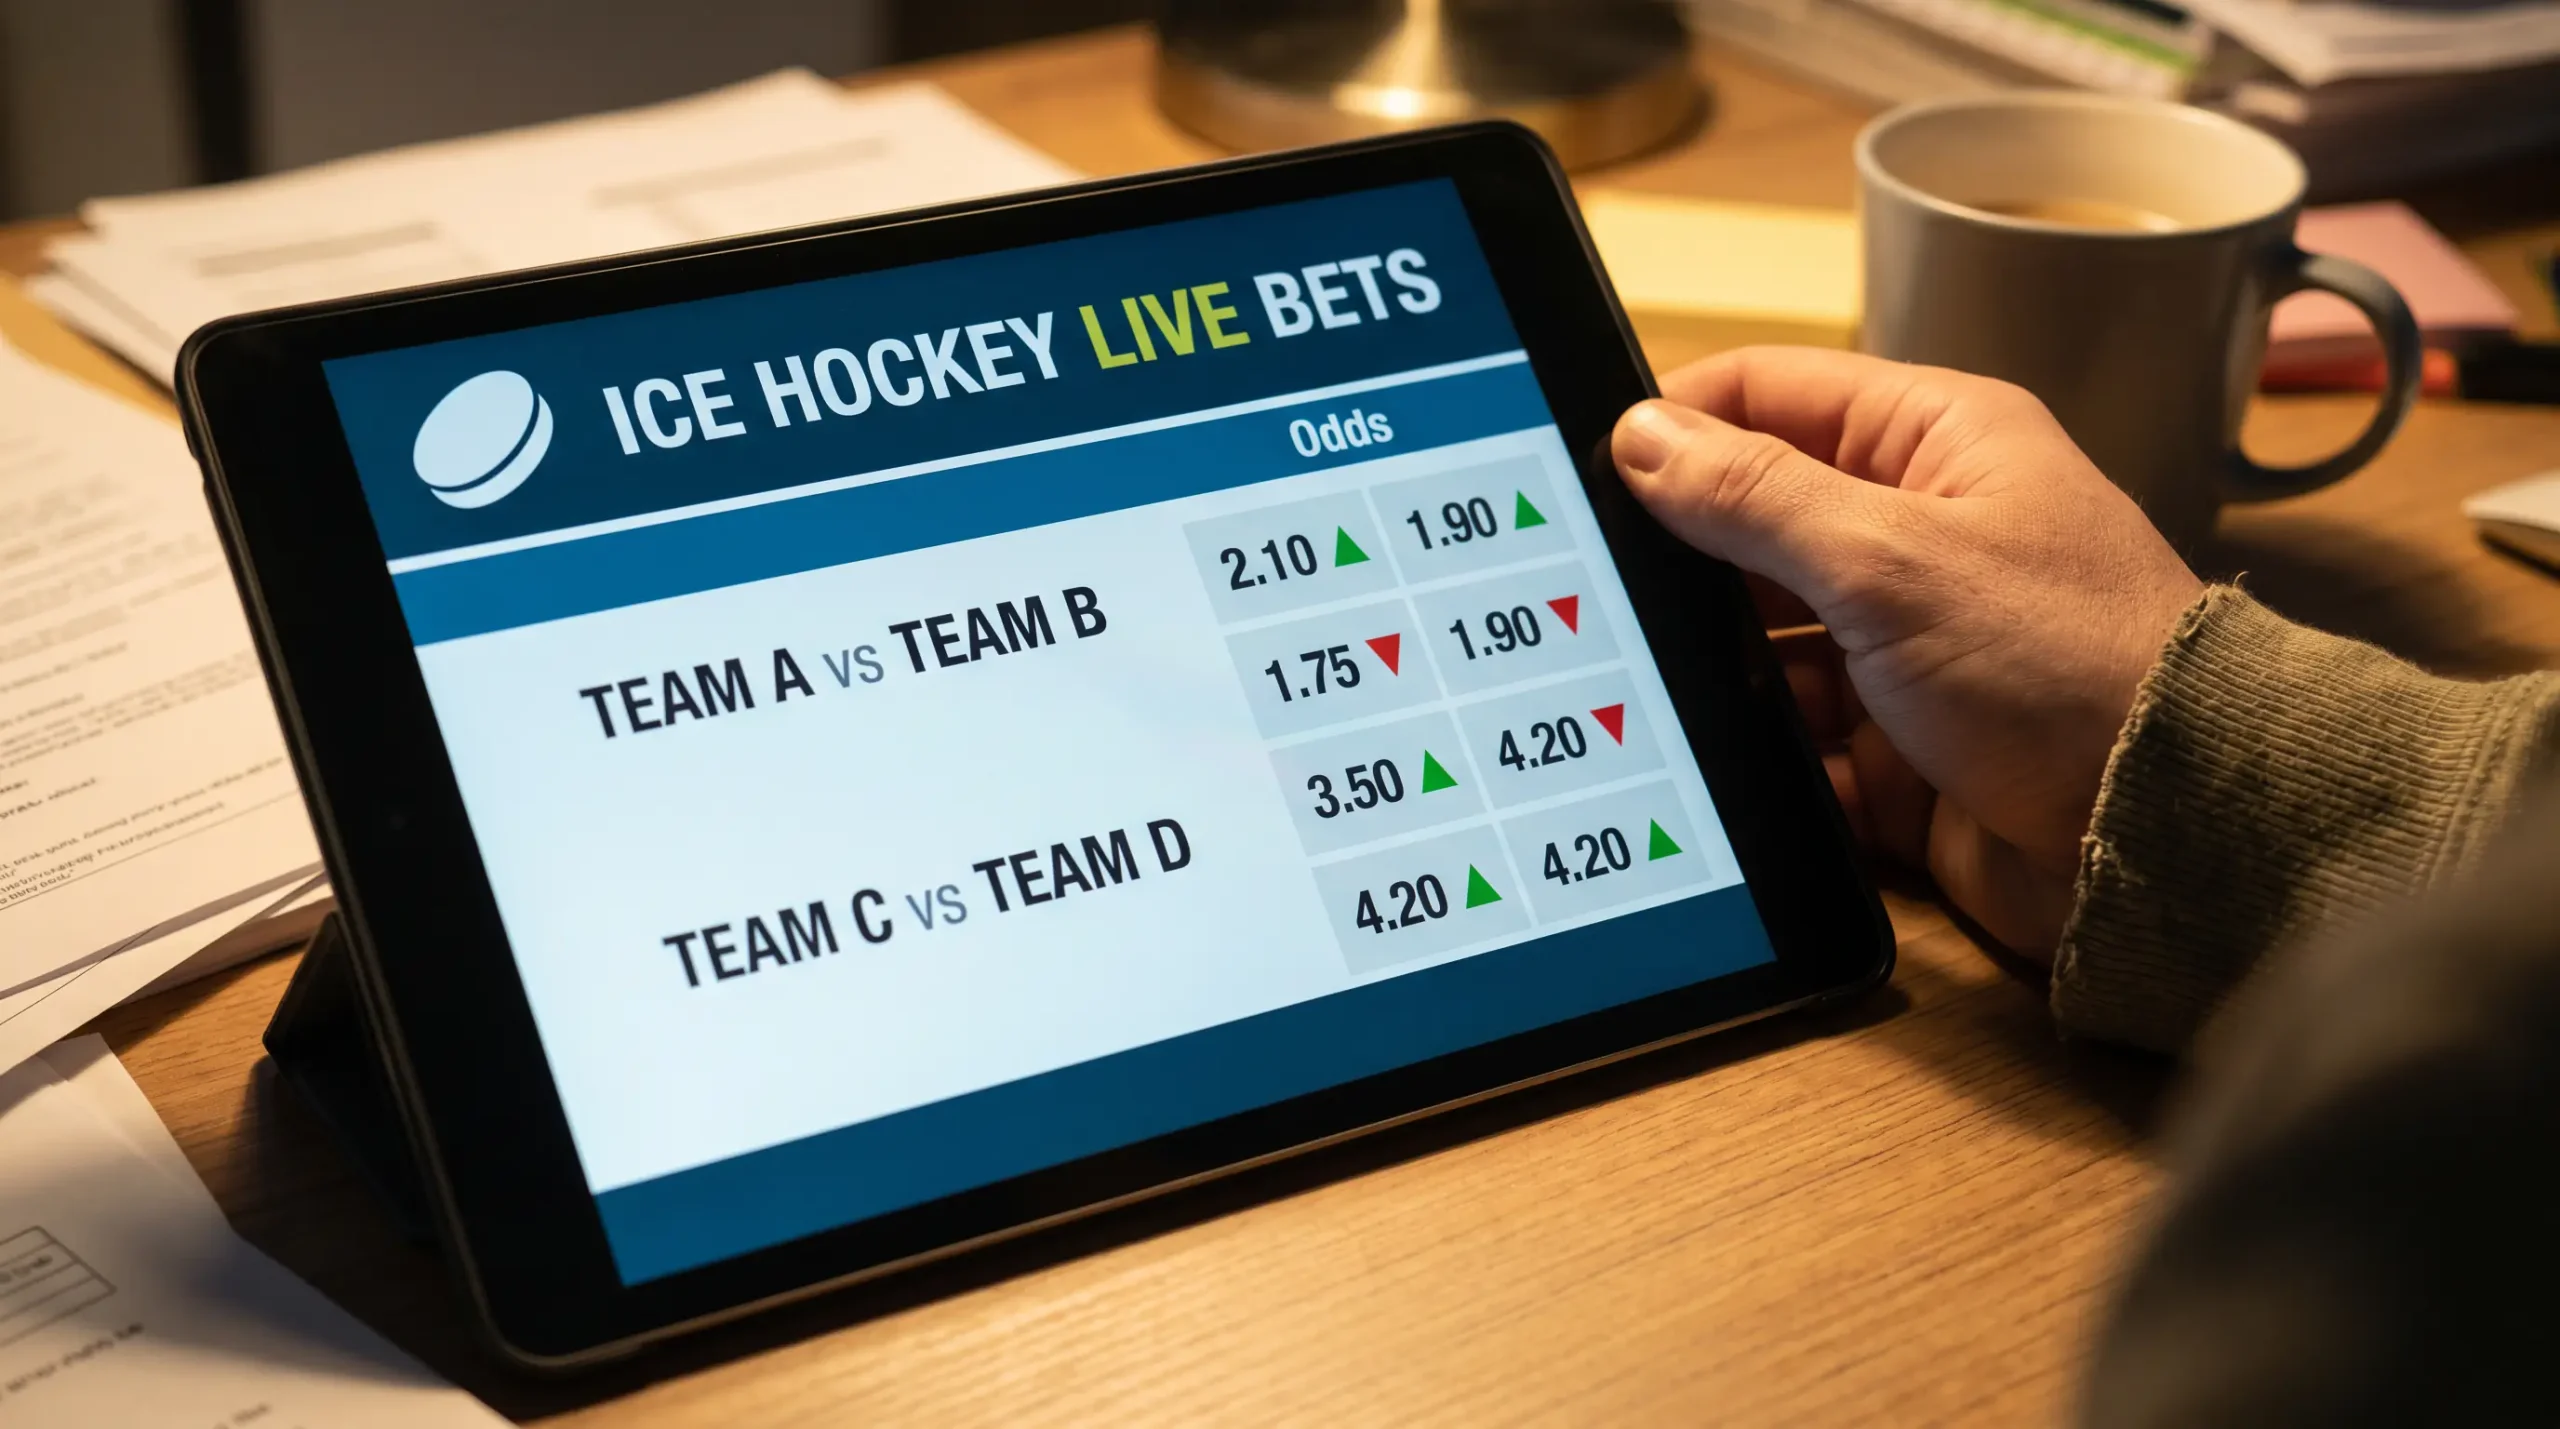
The metric that tells the truth about your betting
Every punter has stretches that look good and stretches that look bad. The honest read on which one is sustainable doesn’t come from the win-loss record. It comes from the closing line value — the gap between the price you took and the price the market settled on at puck drop. If you consistently beat the close, you’re capturing real edge. If you consistently lose to the close, your wins are luck and your losses are structural.
Hockey is one of the cleaner sports for CLV tracking because the lines move sharply on goalie news and injury reports. NHL home favourites won 64.1% straight-up in 2024-25, but the prices on those home favourites moved meaningfully in the 60-90 minutes pre-puck on goalie confirmations and late scratches. The punter who took the early line at +130 before the favourite drifted to +110 captured 20 cents of decimal odds of value, regardless of whether the bet won or lost. That value, repeated across hundreds of bets, is what separates a sustainable approach from a losing one.
What CLV is, with a puck-line example
CLV is the difference between the price you bet at and the closing price, expressed in odds units. The calculation is mechanical once you have both numbers. If you bet a road dog at +1.5 puck-line at -180 and the line closes at -200, you captured 20 cents of positive CLV (in American odds). That 20 cents represents real value — the market consensus moved against your selection, suggesting public money or sharp money pushed in your direction, and you got in before the move.
The puck-line market gives clean examples because the price movements are typically wider than moneyline movements. Underdogs covered +1.5 in about 60% of NHL games in 2024-25, and home favourites covered -1.5 only 41.8% of the time. The market knows these tendencies, but pre-game lines often open before injury news and goalie confirmations have been fully absorbed. A road underdog at +1.5 priced -160 in the morning can drift to -185 by puck drop once the home favourite’s third-line scratch is announced. That 25-cent move is positive CLV for anyone who took -160.

The maths matter. Decimal odds of 2.00 implies 50% win probability. Decimal odds of 1.80 implies 55.6%. The 20-cent move from 2.00 to 1.80 represents the market shifting its implied probability by ~5.6 percentage points. A punter who consistently captures 5-10 cents of decimal CLV per bet across hundreds of bets is generating measurable positive expected value, even if individual bets don’t pay off, because the long-run distribution of outcomes follows the closing-line probability more closely than the opening-line probability.
Why NHL lines move late
NHL closing lines move sharply for three reasons, in roughly the order of magnitude: goalie news, injury news, and sharp money. Each has timing patterns worth tracking.
Goalie confirmations typically arrive 60-90 minutes before puck drop. When the morning skate and pre-game scratches are published, the market consensus on which goalie is starting locks in. Lines can move 0.20-0.40 decimal odds on the confirmation, particularly when an expected starter is revealed as a backup or when an injured starter is unexpectedly cleared to play. The post-audit save percentage environment — league SV% at a 30-year low in 2024-25 — has made these moves more volatile, because the implied gap between starter and backup in expected goals against has narrowed in absolute terms but the market still over-corrects on goalie changes.

Injury news lands less predictably. A late scratch announced 2-3 hours pre-puck can move the line as much as a goalie change. A morning announcement of a key defenceman missing the game can shift the goal total by 0.5 goals and the moneyline by 0.15-0.25 decimal odds. Tracking team announcements on club channels and reputable beat reporters gives a 15-60 minute lead on the line move, which is the window where CLV is generated.
Sharp money is the most subtle driver. When the market sees one-way action from accounts the operator knows to be successful, lines move ahead of any news catalyst. The signal in the pre-game window is steady line movement in one direction without any announced news — a slow drift from +130 to +110 over the course of two hours typically indicates sharp money rather than public money (which tends to come in spikes around social-media moments).
Line shopping across UK books
UK punters with accounts at multiple licensed operators can find price discrepancies of 0.10-0.30 decimal odds on any given NHL match. The pattern of discrepancies follows operator structure: tier-one bookmakers with deep NHL exposure (bet365, Sky Bet) tend to have the sharpest opening lines and move first; mid-tier bookmakers (BoyleSports, Coral) often lag the sharp operators by 5-15 minutes; smaller UK operators can lag further.
The NHL specifically ranks ninth among twelve major hockey leagues in favourite win rate at 61.93%. By contrast, the SHL sits last at 59.04%. That favourite-win-rate gap matters for line shopping — the lower-favourite-win-rate leagues see wider variance in pricing across operators, because there’s less consensus on what the “right” price is for any given matchup. NHL line shopping captures smaller discrepancies but those discrepancies are more reliable. SHL line shopping captures larger discrepancies but the underlying volatility means the “best price” is harder to identify.

The other practical signal: UKGC referred approximately 200,000 illegal-operator URLs to search engines as part of its 2024-25 enforcement push. UK punters should only place bets with UKGC-licensed sportsbooks, both for the licensing protection and for the line accuracy — illegal operators frequently post stale lines that don’t reflect market consensus, and any “value” captured is either bait or unprotected if the operator refuses to pay.
Practically, line shopping across three to five UK-licensed operators is the realistic ceiling for most punters. Beyond that, the operational overhead exceeds the CLV captured. Accounts at one tier-one operator and two mid-tier operators typically gives sufficient pricing visibility to capture the bulk of available CLV without burning hours on every bet.
Tracking CLV in a spreadsheet
The minimum columns for CLV tracking are simple. Date. Match. Market. Selection. My price (the price you bet at). My stake. Closing price. CLV (the difference between my price and closing price, in decimal odds units or percentage). Result. P/L.
The spreadsheet generates two views over time. View one: average CLV across all bets, calculated as the mean of (my odds – closing odds) for losses and the corresponding inverse for wins (because winning at a longer price is positive CLV). A positive average CLV across a sample of 100+ bets indicates the punter is systematically capturing edge. A negative average CLV indicates the opposite, regardless of how the win-loss record looks. View two: CLV by market type. Sort the records by market (moneyline, puck-line, total, props), and you see where your edge is real and where it’s not. Most punters discover they have positive CLV in one or two specific market types and flat or negative CLV elsewhere.

The trap I’ve seen punters fall into is over-tracking. Adding columns for weather, referee, public-betting percentages, and other indicators dilutes the discipline. CLV is the headline number; everything else is secondary. Track the primary metric cleanly across a long sample (200+ bets) before adding complexity. Once the primary tracking is robust, secondary indicators add real value. Before that, they’re noise.
One practical note: the closing line isn’t always easy to find. Some operators publish it; others don’t. The de facto standard is to use the price at puck drop on a tier-one bookmaker (bet365 in UK markets, Pinnacle in international markets when accessible). If the price moved sharply in the 5-10 minutes before puck drop, use the price at 10 minutes pre-drop as the closing reference — that’s typically the cleanest read on market consensus before live in-play pricing takes over.
CLV versus ROI as edge signals
ROI and CLV are both measures of punter performance, but they measure different things. ROI is backward-looking — what you made or lost across a sample. CLV is forward-looking — whether your selection process is systematically beating the market consensus. The two are correlated over very long samples (10,000+ bets) but can diverge sharply over short samples (under 500 bets), because variance dominates ROI in short samples.
The practical implication: a punter with positive CLV but negative ROI over 200 bets is almost certainly running below variance and should expect ROI to catch up over the next 200-500 bets. A punter with negative CLV but positive ROI is almost certainly running above variance and should expect ROI to deteriorate. CLV is the leading indicator; ROI is the lagging confirmation.

For decision-making, the priority is straightforward. Maximise CLV — bet at the best price available, time entries to capture pre-news pricing, line-shop across UK-licensed operators. The ROI follows over long samples. Chasing ROI directly (placing bets at any price because the win rate has been positive) typically leads to mediocre selections at terrible prices, which compounds against the punter even if individual outcomes are favourable. The connection between CLV discipline and broader moneyline analysis, including the specific case of NHL home favourites and underdogs, sits in applying CLV checks to moneyline picks.
Frequently asked questions
Two questions punters ask me about CLV in the NHL specifically. Both touch the practical mechanics of capturing the metric.

How is CLV calculated for an NHL moneyline bet?
Take the price you bet at and the closing price at puck drop in the same odds format. The difference is your CLV. If you bet a road underdog at +145 (decimal 2.45) and the line closes at +120 (decimal 2.20), you captured positive CLV of 25 cents in American odds, or 0.25 in decimal. The percentage form is sometimes preferred: ((your odds – closing odds) / closing odds) gives a normalised CLV percentage. For NHL, average CLV above 2% across a sample of 100+ bets indicates measurable edge — the punter is consistently capturing pricing inefficiencies. Average CLV below 0% indicates the opposite, regardless of how the win-loss record looks over the short term.
Which UK bookmakers offer the sharpest NHL closing lines?
Tier-one UK-licensed operators with deep NHL exposure — primarily bet365 and Sky Bet — tend to have the sharpest closing lines because their volume and integration with international markets force fast price discovery. Mid-tier UK operators (Coral, BoyleSports, William Hill) typically lag by 5-15 minutes on line moves and can offer better pre-move prices for punters watching news catalysts. Smaller UK-licensed operators sometimes lag further but with lower line accuracy across the board. The practical line-shopping approach for most UK punters is to maintain accounts at one tier-one operator and two mid-tier operators, which gives sufficient pricing visibility to capture meaningful CLV without operational overhead becoming the bottleneck.
