
 Available in US
Content

The Boxing Day window most UK punters under-use
The World Junior Championship 2025 in Ottawa drew 296,894 spectators across 29 matches at an average of 10,238 per game — a higher per-game attendance than the senior IIHF Worlds. For UK punters, that audience density translates into betting markets with depth, liquidity, and operator coverage that doesn’t always exist for other IIHF tournaments. The WJC runs during the Boxing Day-to-New-Year window when UK punters have time, attention, and dedicated holiday betting bankrolls, and the tournament fits the calendar like few other international hockey events.
The WJC is the IIHF’s U20 championship — ten national teams, mostly the established hockey nations with North American and European competitive backbones, playing through a round-robin and knockout format across two weeks. The structural pattern is well-defined: Canada and USA dominate the gold medal markets, Sweden and Finland populate the bronze and silver positions, and the broader field competes for the remaining knockout slots. The rest of this piece walks through the format, the favourite structure, the prop markets unique to U20 tournaments, and the upset patterns worth knowing.
WJC format and tournament schedule
The WJC features ten teams split into two groups of five for the round-robin preliminary stage. Each team plays the other four teams in their group across roughly five matches. The top four teams from each group advance to the quarter-finals, which begin the knockout phase. Quarter-finals are single-elimination, followed by semi-finals and the bronze and gold medal matches.
The schedule typically runs December 26 to January 5, which makes the tournament the headline international hockey event of the Boxing Day window for UK punters. The 296,894 total attendance across 29 matches in WJC 2025 reflects the tournament’s growing audience reach — the per-match average of 10,238 puts WJC ahead of the senior Worlds in spectator density, and the betting markets follow the engagement.

The competitive structure means the round-robin matches between the top-tier nations (Canada-USA, Canada-Sweden, USA-Finland) are effectively decisive for group standings, while matches against the weaker fifth-seed teams (Latvia, Germany, Switzerland depending on the year) are typically lopsided. The market reflects this — top-tier matches are priced as competitive contests with moneylines in the -130 to +110 range, while mismatched matches feature moneylines of -800 or longer for the heavy favourite.
The implication for round-robin betting: focus on the competitive top-tier matchups, where the price reflects genuine uncertainty and structural edges are findable. The mismatched matches offer little value at the moneyline (the heavy favourite price approximately matches the actual probability) and the puck-line or totals are the more interesting markets in those subsets.
Canada vs USA as the default final
Canada and USA combine to win the WJC gold medal in roughly 75-80% of recent editions. The other 20-25% has been split among Sweden, Finland, and occasional Russian wins (when the country was eligible). The structural reason is the depth of the North American development systems — both countries produce significantly more NHL-quality U20 prospects than any other nation, and the WJC roster includes most of them.
The pre-tournament outright market for Canada typically prices at 2.20-2.80, with USA at 3.00-4.00. The implied probabilities combine to roughly 55-65% for the Canada-USA bloc. The actual win rate for the bloc historically runs 75-80%, which is a 10-20 percentage point structural undervaluation of the combined Canadian-American chance. The “Canada or USA to win gold” prop (where offered) is the structural value play on the pre-tournament market.
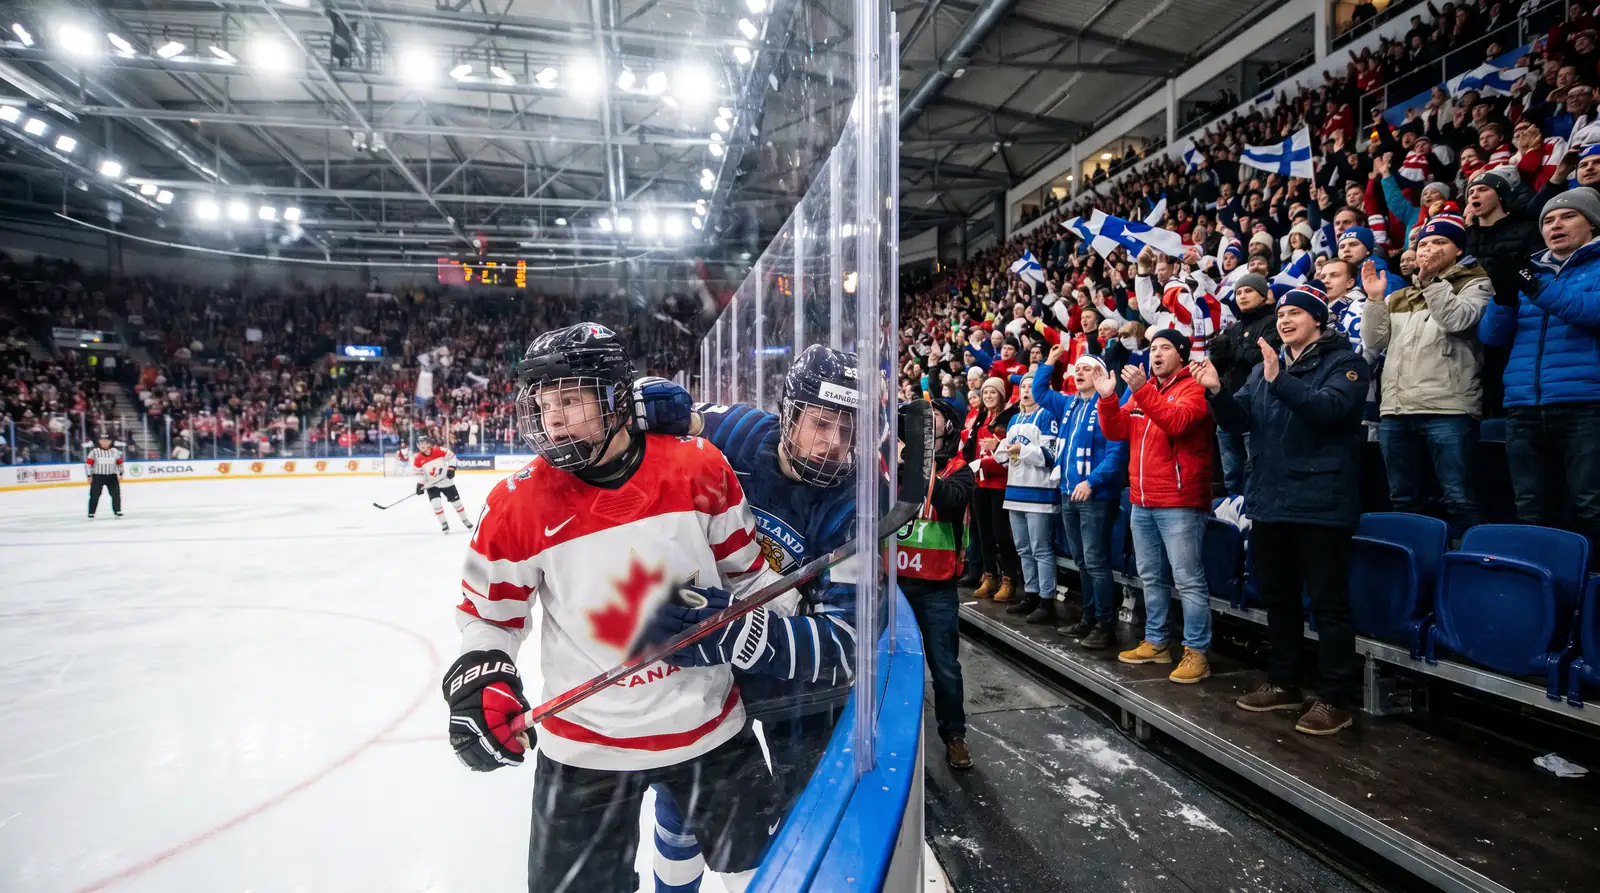
The narrower bet is Canada specifically, which has been the more dominant single nation across the past decade. Canada at 2.30 implies 43.5% win probability; the actual rate runs 45-55% across recent editions. The marginal edge depends on the specific squad and host venue (Canada at a home WJC has a measurable additional edge of 3-5 percentage points).
The historical pattern of Canada-USA gold medal finals is well-known but worth quantifying. Across the past 15 WJC editions, the gold medal final has been Canada-USA in roughly 7 of 15 cases — about 47%. The pre-tournament prop on “USA-Canada final” typically prices at 3.50-4.50, implying 22-29%. That’s a 18-25 percentage point structural undervaluation, and the prop is the cleanest single bet on the pre-tournament market when offered.
Pre-draft prospects and prop markets
The WJC features many players who are pre-draft (eligible for the next NHL Draft but not yet selected) or recently drafted but yet to play in the NHL. Their performance at the tournament can substantially shift their NHL draft stock, which feeds into the prop markets that operators offer for the tournament.
The top scorer prop is the principal prop market. The pre-tournament price for “tournament top scorer” typically lists 8-15 candidates at decimal odds 4.00-25.00. The favourites — usually the projected top NHL draft picks playing for Canada, USA, or Sweden — sit at the short end of the range. The structural pattern: the actual top scorer of WJC has been a Canadian or American forward in roughly 70% of recent editions, with Swedish and Finnish forwards splitting the remaining 30%.

The implied probability of a Canadian top scorer in the pre-tournament market typically runs 30-40% combined across the Canadian candidates. The actual rate is 40-50% combined. That’s structural value on the Canadian bloc for tournament top scorer.
The other useful prop market is the goalie performance markets. WJC goaltenders are typically U20 prospects with limited international experience, which produces wider SV% variance than senior tournaments. Tournament-best goalie SV% has been above .930 in roughly half of recent editions, well above senior-tournament typical figures. The structural pattern reflects the smaller sample size (5-7 matches per goalie) and the U20 talent variance.
Group-stage upsets and totals
IIHF Worlds 2025 in Sweden and Denmark averaged 5.83 goals per match across 64 matches, with 489,450 total spectators. The WJC scoring rate runs higher — typically 6.5-7.5 goals per match across the tournament, partly because U20 defensive structures are less refined than senior tournament defensive systems and partly because the heavy favourite-underdog matchups produce inflated goal totals.
The 6.5 total Over at -110 in WJC matches has historically hit at 58-62% across recent editions, against an implied 52-54%. That’s a structural Over bias in the WJC environment. The 7.5 total at -120 to -130 implies 56-60% Over hit rate; actual rate runs 55-60%. Approximately fair value at the 7.5 line.

The group-stage upset pattern is also worth knowing. Mid-tier WJC teams (Slovakia, Switzerland, Germany, Latvia in recent editions) occasionally beat top-tier teams in group-stage matches. The upset rate runs around 8-12% in mismatched group-stage matches, well above the implied probability of 4-6% at typical pre-match prices. The underdog moneyline at +500 or longer in those mismatched matches is a small-stake speculative bet with positive expected value across the long sample, though individual variance is high.
WJC vs senior Worlds: betting differences
IIHF Worlds 2026 in Switzerland drew 466,314 spectators across 64 matches at 7,286 per game average, with Finland winning their 5th title. The senior Worlds averaged 5.8 goals per match, similar to the 2025 edition’s 5.83. The WJC’s 6.5-7.5 goals per match and 10,238 per-game attendance puts the U20 tournament ahead of seniors in both scoring rate and per-match audience density.
The structural betting differences: WJC matches show wider goal variance (more high-scoring blowouts, more close 2-1 defensive battles), while senior Worlds matches are more consistently in the 5-6 goal range. The WJC favourite-win-rate in mismatched matches is higher than senior Worlds because the U20 talent gap between top and weak nations is wider. The senior tournament, by contrast, sees more competitive matchups across the field.

The other difference is operator coverage. UK-licensed operators carry WJC markets more aggressively than they used to, partly because of the Boxing Day timing fit and partly because the tournament has built genuine UK audience reach. Mid-tier UK operators that may not carry senior Worlds markets often carry WJC, which increases line-shopping options for UK punters.
For betting strategy, the WJC pattern favours pre-tournament outright bets on Canada or the Canada-USA bloc, top-scorer props on Canadian candidates, and structural Over bets on the 6.5 total line. The senior Worlds pattern favours individual match betting with focus on home-host advantages and group-stage upsets, since the senior tournament has more competitive variance across the field. The cleaner integration between these patterns and the broader best-on-best tournament environment, including the Olympic context, sits in WJC prospects who later make Olympic squads, where the U20-to-Olympic transition gets a dedicated treatment.
Frequently asked questions
Two questions UK punters ask about the WJC most often. Both touch the Canada-USA dominance and the Boxing Day timing.

Why is Canada or USA usually the gold medal favourite at WJC?
Canada and USA combine to win WJC gold in roughly 75-80% of recent editions because both countries produce significantly more NHL-quality U20 prospects than any other nation. The WJC roster includes most of those prospects each year, which creates a structural depth advantage across all four lines and the goaltender position. The remaining 20-25% of gold medals have split between Sweden and Finland, with occasional Russian wins when the country was eligible. The pre-tournament prop on Canada or USA to win combines implied probabilities of roughly 55-65% against the actual rate of 75-80%, making the bloc bet one of the cleaner pre-tournament value plays.
How does WJC scheduling fit the UK Boxing Day window?
The WJC runs from December 26 to January 5 each year, which aligns precisely with the UK Boxing Day-to-New-Year holiday window. UK punters have time, attention, and dedicated holiday betting bankrolls during this window, and the tournament’s per-match attendance of 10,238 in 2025 indicates the growing audience reach. UK-licensed operators carry WJC markets more aggressively than other IIHF U20 tournaments because of the Boxing Day timing fit, which produces deeper market liquidity, more line-shopping options, and broader prop market coverage than senior IIHF tournaments outside the major championships. The structural fit between WJC scheduling and UK betting habits explains the tournament’s persistent UK market presence.
