
 Available in US
Content

Why the playoff line is a different animal
The Florida Panthers won back-to-back Stanley Cups in 2024 and 2025, taking the 2025 Final against Edmonton in six games. That sequence, more than any in the past decade, illustrates how the playoff market works. Pre-tournament outright on Florida in 2024 was around 12.00. By the conference finals it had dropped to 3.50. By Game 7 of the Final it was 1.40. The Panthers were the same team the whole way through. The line moved because the market kept recalibrating against a series structure that demands different priors than the regular season.
Adrian Horton at ESPN BET has summed up the playoff dynamic better than anyone — “NHL Playoffs are very unique, with smaller margins between even the best and worst teams.” That single line is the foundation for almost every edge worth chasing in the postseason market. The rest of this piece pulls the implications apart, working from the regular-season-to-playoff shifts down to specific series-price structures.
How playoffs and regular season actually diverge
The first measurable difference is the margin compression Horton flags. NHL regular-season home favourites win at 64.1% straight up. Playoff home favourites in 2024-25 came in around 56-58%. The eight-point drop reflects three things stacking on each other.
First, the playoff field has no weak teams. Sixteen of 32 clubs make the bracket. The bottom of the bracket has roughly the strength of the regular-season league median, not the regular-season last-place team. That alone tightens the implied margin between favourite and underdog in every matchup.

Second, the goalie effect is amplified. A hot goalie carrying a series can flip a 1-3 underdog into a 4-3 winner. The goalie’s contribution to expected wins in a single playoff series can be worth 15-25 percentage points of game-by-game win probability, which is well above the 5-10 point swing a goalie typically contributes in the regular season. The starter’s recent form (rolling 10-game SV% from late-season play) matters more than season averages.
Third, special teams tighten. Referees call fewer penalties per game in the playoffs — closer to 4.5 versus 5.0 in regulars — and total goals drop by 0.3-0.5 per game. The 6.5 Under hits at 60-62% in playoff games versus 57% in the regular season. Teams that built regular-season edge on a top-tier power play lose some of that edge in the postseason environment.
The cumulative effect is the line shrinkage that catches casual punters. A team that was -180 home favourite in March will frequently sit at -130 in the same matchup in May, not because the team is weaker, but because the playoff environment has compressed the implied gap. Punters who don’t recalibrate continue chasing 64% win rates in a 56% environment.
Series price maths for 4-1, 4-2, 4-3
Series prices are the cleanest expression of playoff edge because they collapse seven games of variance into a single market. The three most-bet outcomes — 4-1, 4-2, 4-3 in either direction — have implied probabilities and historical hit rates worth knowing.
A team winning a best-of-seven 4-1 means they took four of the first five games. The historical hit rate across NHL playoff series is about 18-20%. Operators typically price the 4-1 outcome for a clear favourite (priced around 1.45-1.55 on the series moneyline) at 4.00-5.00. The implied probability of 4-1 at 4.50 is roughly 22%. That’s marginally over-priced versus the historical baseline of 18-20%, which means 4-1 props on heavy favourites are typically a small fade.

A 4-2 series result happens in about 23-25% of NHL playoff series. Operators price 4-2 for a clear favourite at 3.50-4.00 — implied probability around 28%. Again, marginally over-priced versus history. The 4-2 prop is the closest to fair-value among the three common series-length bets, but it still tilts slightly against the punter.
A 4-3 series — going the distance — happens in about 25-27% of NHL playoff series. The 4-3 prop typically prices at 4.50-5.50 for either direction, with implied probabilities of 18-22%. That’s where the value lives. Historical 4-3 frequency is 25-27%, meaning the implied probability is under-rating the longer series by 3-7 percentage points. The bet that consistently works is the 4-3 favourite — taking the favourite to win, but in seven games — when the favourite has clear edges but the underdog has a credible counter (a strong goalie, home ice in Game 7, or a recent regular-season head-to-head split).
The other angle: alternative series totals like “over 5.5 games” trade in some shops. The implied probability for a series going more than 5.5 games is roughly 52-55% historically — and the price is typically -110 to -120 on the over. That’s a clean structural bet, especially in matchups between top-six teams where margins are tight.
The hot-goaltender effect as a series pivot
Save percentage hit a 30-year low league-wide in 2024-25, but that’s a regular-season average that smooths out the playoff variance. Individual playoff goalies running on hot streaks have posted SV% well above .920 across full series — and that level of play has flipped multiple recent series against pre-series favourites.
The pattern: a goalie carrying a regular-season SV% around .905-.910 enters the playoffs and posts .925+ over the first three or four games of a series. The series price on his team, which started at around 2.20 (an underdog), moves to even-money or shorter. The market is correctly identifying that the goalie is the swing variable, but operators tend to under-react in Games 1 and 2 and over-react in Games 3 and 4. The value window is the in-series price drift between Games 2 and 3, where the line is moving but hasn’t fully caught the form.
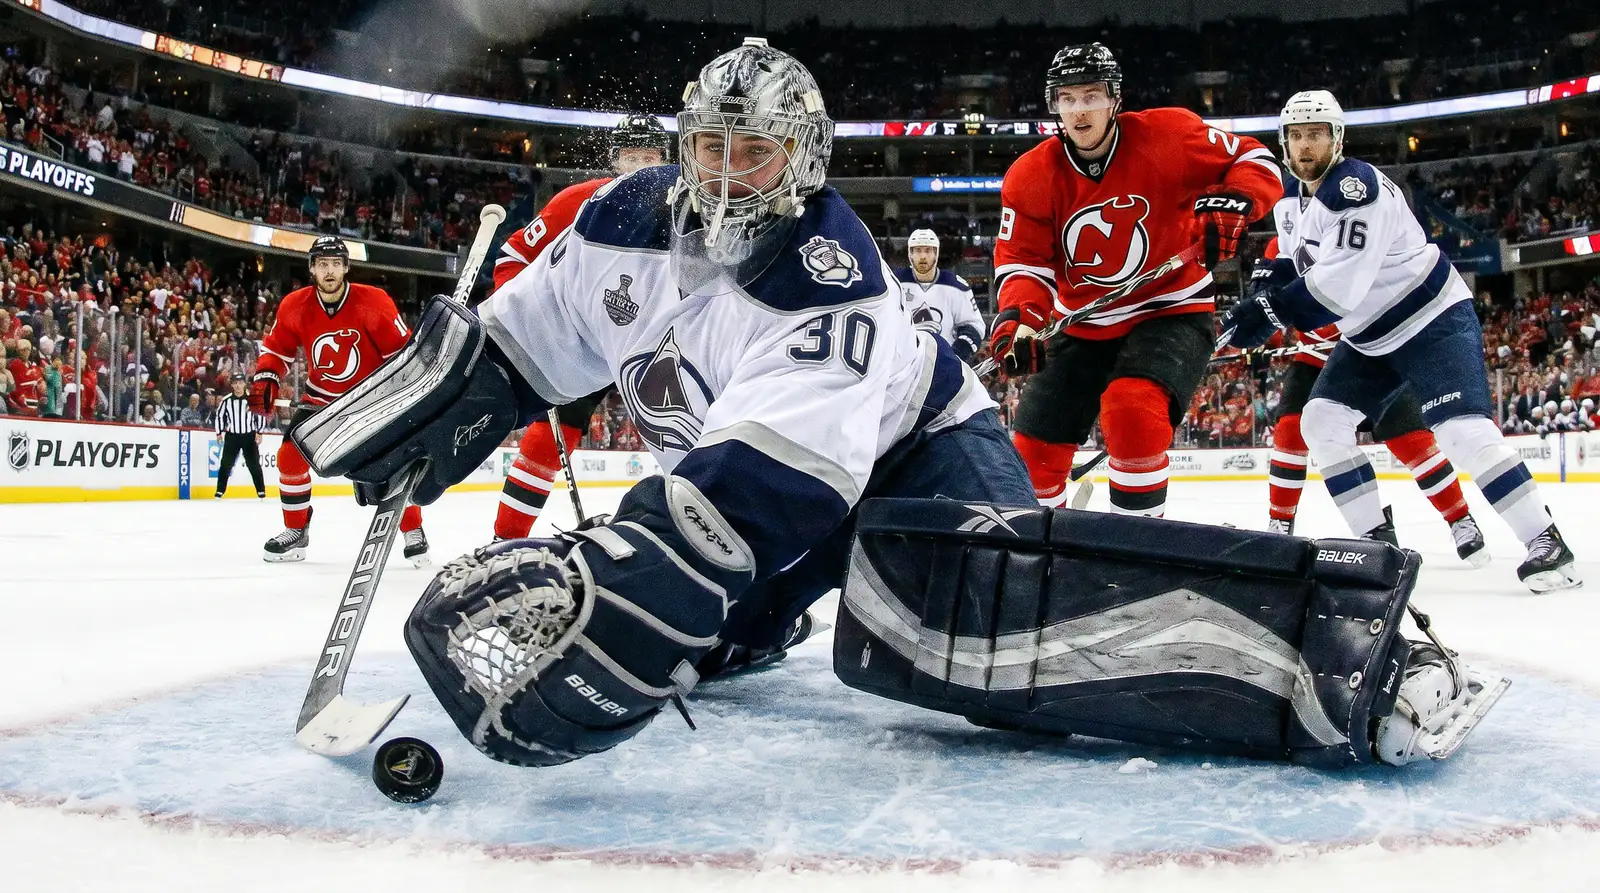
The reverse trap is the goalie who slumps in Game 1. A starting goalie surrenders 5+ goals in Game 1 of a series. The series price on his team drifts to long odds for Game 2. Historically, Game 1 results in playoff series have low predictive power for the series outcome — the team that loses Game 1 still wins the series about 38-40% of the time. The Game 2 over-correction creates a back opportunity on the now-undervalued favourite.
Tracking starter confirmations is essential. Playoff starting goalies are usually confirmed by the morning skate, but rotation calls in lopsided games (a coach pulling a struggling starter for the backup mid-game) can shift Game N+1 expectations sharply. The market response to a backup start in a playoff series is typically a 0.3-0.5 decimal-odds shift on the team moneyline, which is steeper than the regular-season equivalent.
How home ice resets across the bracket
Regular-season NHL home favourites won 64.1% straight up in 2024-25. Playoff home favourites compressed to 56-58%, but that average hides series structure. Game 1 home favourites — the top seed opening at home in their division series — won at roughly 60-62%. Game 4 and Game 5 home teams, where the home-ice “advantage” has rotated, won at closer to 53-55%. Game 7 home favourites, with the win-or-go-home crowd impact, won at 60-65% across the past decade.
The takeaway: home ice in the playoffs is sharpest in Game 1 (fresh series, full crowd impact, top seed’s first home matchup) and Game 7 (decisive game, maximum crowd leverage). It’s softer in Games 3-5, where the away team has had time to study the home team’s structure and where home-ice fatigue from the series travel starts to bleed in.
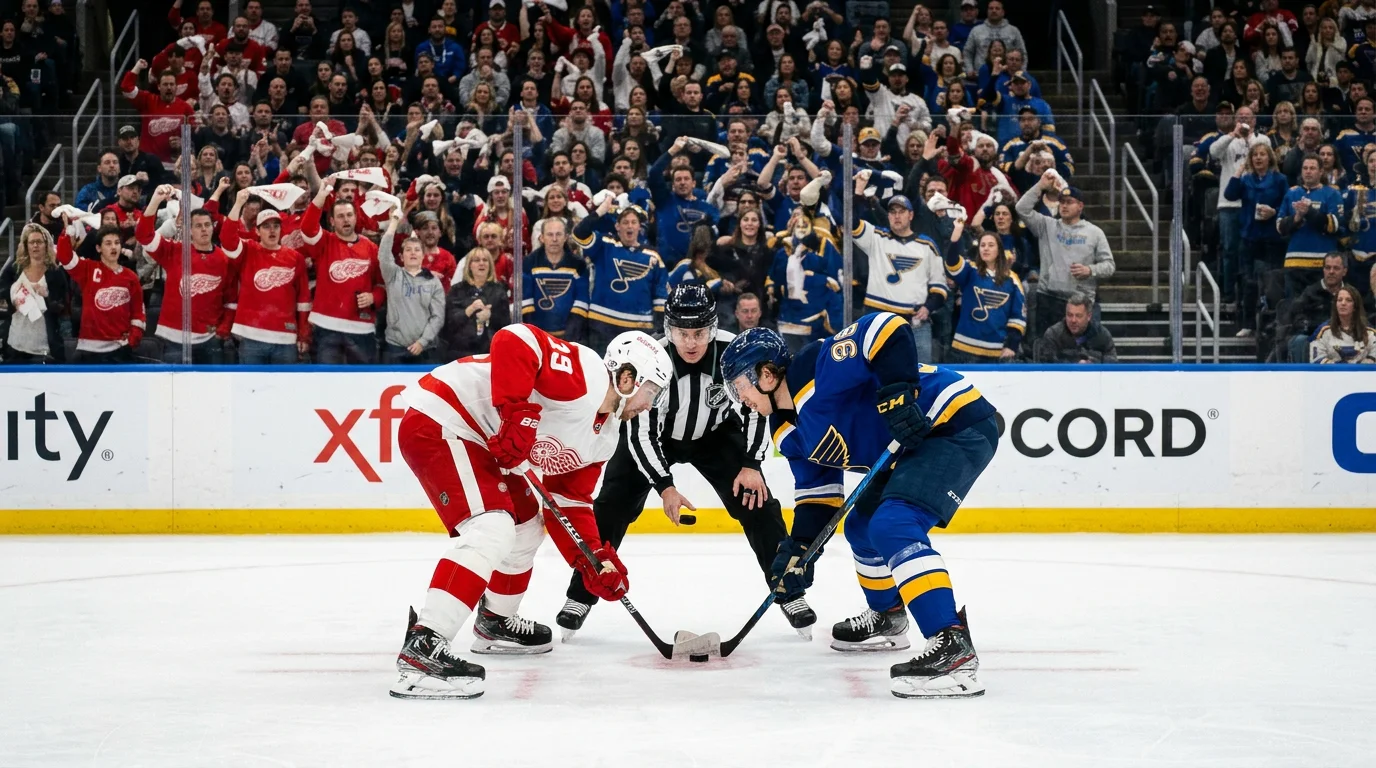
The market typically prices Game 1 and Game 7 home favourites with a premium that approximately matches the historical edge. The opportunity is in Games 3-4-5, where the market often applies a regular-season-style home premium that doesn’t survive the playoff compression. Road favourites in Games 3-4 at +120 to +150 (priced as underdogs because they’re on the road) have historically over-performed their implied probability, particularly when they took 2-0 leads at home in Games 1-2.
The totals shift, and the low-scoring playoff bias
The 6.5 total Under hit 57% in the 2024-25 regular season at an average of 6.1 goals per game. Playoff totals shift further: average goals per game drop to roughly 5.5-5.8, and the 6.5 Under hits at 60-62%. The 5.5 Under, which is typically priced -125 to -135 on playoff games, hits at around 47-50% — fair value at best.
The mechanism: playoff defensive structures are tighter, goalies start the bulk of the games (no B2B rotation diluting the talent on ice), and special teams trades are more conservative. The over-correction risk is the high-pace series — a Game 7 between two offence-heavy teams (Edmonton vs Florida 2025 Final averaged closer to 7+ goals across the six games, ahead of the typical playoff average) can spike well above the line. But over a long sample, playoff totals trend low.
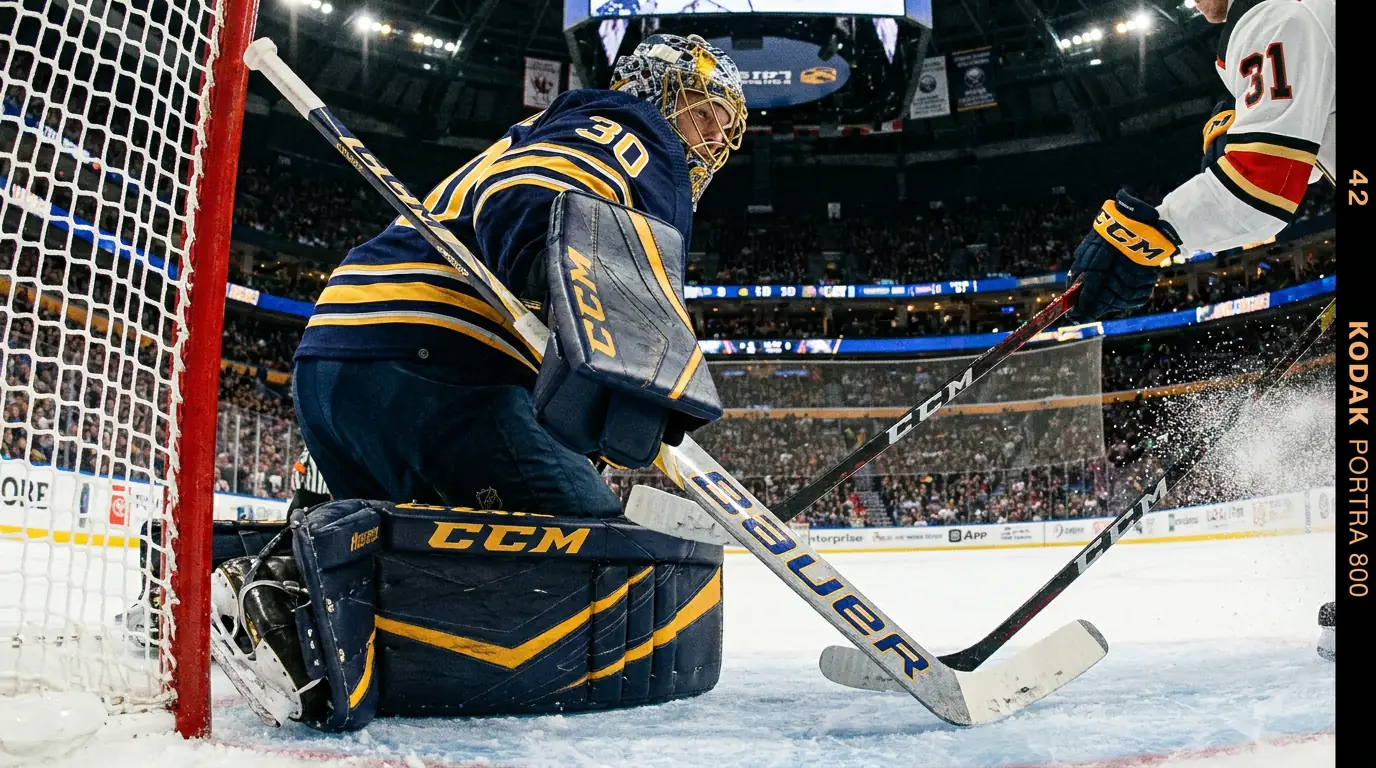
For UK punters, the cleanest play is the live-game adjustment. A playoff game tied 1-1 entering the third period typically sees the operator’s live total drop to 4.5 or 5.0, with the Under priced around -120 to -130. The implied probability is roughly 54-57%. The actual hit rate is closer to 60-63% in playoff third periods, where defensive structure tightens further as the game advances. That’s a small but reliable structural play. The fuller treatment of how single-game and series markets interact across formats, including how the EIHL Playoff weekend differs structurally, sits in how EIHL playoff format differs from NHL series betting.
Frequently asked questions
Two questions come up regularly about the playoff shift, and both touch the parts of the model that need explicit recalibration once spring arrives.

How much do NHL playoff totals shift compared to the regular season?
The shift is roughly 0.3 to 0.6 goals per game. Regular-season 2024-25 averaged about 6.1 goals per game with the 6.5 Under hitting 57%. Playoff games typically average 5.5-5.8 goals per game with the 6.5 Under hitting 60-62%. The drop reflects tighter defensive structures, fewer penalties per game (about 4.5 versus 5.0), and stronger goaltending from teams that earned playoff spots. Markets sometimes lag on this — particularly in series between offence-heavy teams where pre-series numbers can sit at the regular-season baseline despite the playoff environment. The 6.5 Under, priced typically at -110 to -115, is a structural play across the bracket.
Are road favourites worth backing once the playoffs start?
Yes, particularly in Games 3, 4 and 5 of series where home ice has rotated. The market often applies a regular-season-style home premium to the home team in these middle-series games that doesn’t survive the playoff compression. Road favourites at +120 to +150 in Games 3-4, especially after the road team took a 2-0 or 1-1 lead in the first two games at home, have historically over-performed their implied probability. The exception is Game 7, where home favourites carry a genuine and persistent edge of 60-65% straight up over the past decade, well above the broader playoff home-favourite baseline of 56-58%.
